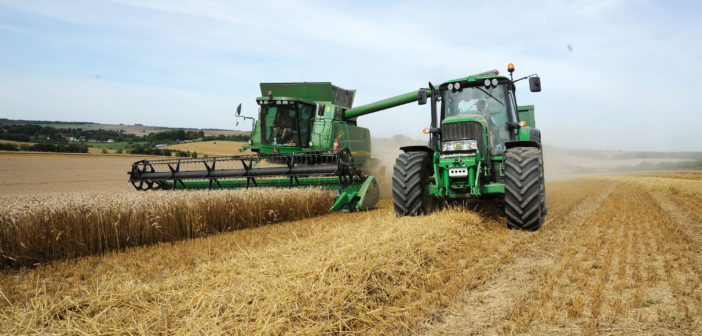
New active mapping of farms’ crop yield results this season will build an invaluable picture of geographical variety performance – and give growers the cool chance to celebrate a harvest festival.
The simple on-line Syngenta Harvest Yield Map 2017 will collate growers’ reported results into a UK wide resource of variety performance trends by region, with detail down to postcode area.
Syngenta marketing communications lead, Cat Gray, highlighted the harvest data will give a valuable insight into how all different varieties have performed under the UK’s extremely variable conditions this season.
“Growers have experienced a huge North/South divide in climatic conditions this year. Over recent months, for example, it has been cool and wet in the north, in stark contrast to blistering hot, dry weather in the south and east” she said. “The Harvest Yield Map will help to indicate how different varieties have coped with the variable conditions, and an indication for future cropping options to consider.”
Whilst many other factors influence final yield on farm, the harvest results did give a reliable reference point for relative variety performance under regional conditions.
Cat pointed out the Harvest Yield Map is incredibly quick and easy to complete, with growers completing a report having the chance to win one of three fantastic cool box hampers, packed with goodies to celebrate a successful harvest home.
The Syngenta Harvest Yield Map 2017 results can be completed in seconds for winter wheat; winter barley; spring barley; hybrid barley and oilseed rape, using smartphone, tablet or computer, on the Syngenta website: www.syngenta.co.uk


